
Postfix Mail Server Reporting |
Обновлено: 15.06.2025 - 21:56
I have a postfix-based mail server and SpamAssassin as an antispam. There was a task to view statistics to analyze the effectiveness of antispam and the mail server settings.
At first I try to use sa-stats.pl script, but it have, in my opinion, too many disadvantages:
1.Written on Pearl and requires the installation of a large number of Perl modules.
2. The result is displayed only in plain-text and html
3. Report only on the letters that went through SpamAssassin
4. Can not send results to mail
This was not enough for me. I would like to see the report about letters that were rejected by the settings of Postfix too. I have not found a utility that would satisfy me. In general, I had to strain and create my own bike. :)
As a result of some effort, this script was written.
It use:
GNUPlot — for statistics histogram paint
Base64 — to encode an image to be inserted into an html page
Wkhtmltopdf — to create pdf from html
Mutt — to send this report by mail
And the script written on bash
Attention! The wkhtmltopdf version of the repository is not suitable for us. It requires an X-server. Of course, if you are on the server ready to install the X-server on the server, then everything will work for you. I do not want to do it. Therefore, you need to download a statically-generated version with the required architecture from the developer's site.
As a result of this script, reports of the following type arrive at the mail
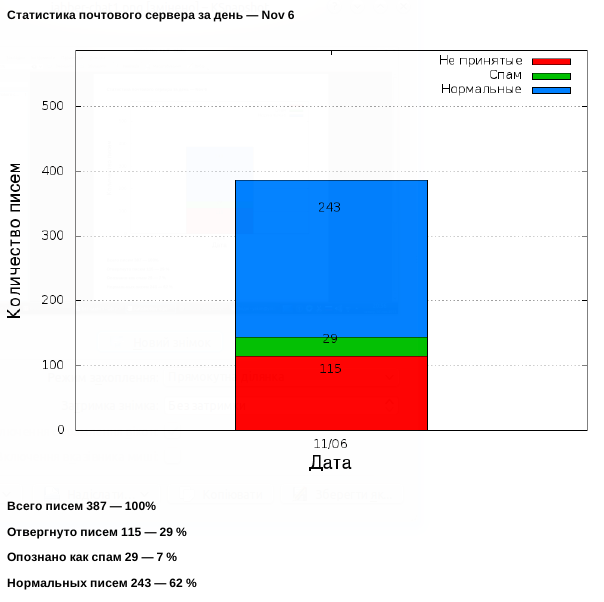
It can build reports for a day or a week.
At the beginning of the script, the variables that you must to set up for correct work:
addr — address for sending reports
MAILFROM — sender address of the report
SUBJECT — Subject
HTML2PDF —The path to the binaries of the downloaded version of wkhtmltopdf
log — path to the mail log file
old_log — path to the previous mail log file (after logrotate)
In addition, the next block is the text messages that are displayed in the report. They can also be changed if desired.
The create_gnuplot function generates a script for creating a graphical part of the report.
With the help of minimal changes it is possible to transform the histogram into something else.
You can download script HERE.
Kindly requested to everyone - do not be lazy comments or write mail about this script.
Please note that I am not a bash programming ace. So I will accept the criticism with pleasure.
------------------------
Код PHP на HTML сайты
Категория: Компьютерные советы
| Комментарии |